When 47 Alarms Go Off at Once, Where Do You Start?
When 47 channels trigger alarms simultaneously across three data centers, broadcast engineers face a diagnosis problem. Without context showing how those channels connect, you’re clicking through feeds individually, checking whether each shares infrastructure, network paths, or dependencies. The data exists, but it’s flat—47 separate alarm entries with no indication that 45 trace back to a single failed component.
The Diagnosis Problem
You pull up your monitoring system and see dozens of red flags. You start clicking through feeds one by one. Five minutes in, you’re no closer to understanding what’s broken. Ten minutes in, your phone rings: the operations manager wants to know how long until you have an answer.
The issue isn’t your monitoring. You’re getting all the data. The problem is that data is flat:
- Channel 1: Video freeze detected
- Channel 2: Video freeze detected
- Channel 3: Video freeze detected
This list doesn’t show you that all three share the same “Sports” content group, connect through multicast address 239.1.1.x, originate from the same Denver encoding rack, and use the same primary transcoder (TC-07). That shared infrastructure context exists in your documentation and config files, but not in your alarm view.
You’re building that context in your head while alerts keep piling up.
The Solution: Visual Hierarchy That Matches Your Operation
TAG’s Lens organizes your channels and their alarms into a visual hierarchy that matches how your operation is actually structured.
Instead of a flat list, you see your entire system organized the way you think about it: by data center, content type, network path, or whatever makes sense for your workflow.
Each group shows exactly how many feeds are affected and the severity distribution at a glance. Color-coded indicators tell you immediately whether you’re looking at isolated issues or a systemic problem.
Here’s that scenario with Lens:
You open the interface.
The US West data center shows 47 active alarms—all red (critical), all “video loss” errors. You expand it: 6 sub-groups appear, but only “Playout Ingest” shows red. You expand that: 47 feeds, all connected to Rack 7A. Click any feed to highlight its connections: all 47 share the same ASI-to-IP gateway (device tag: GW-7A-01) as their primary ingest point.
Root cause: ASI-to-IP gateway GW-7A-01 has failed. All 47 channels require failover to backup gateway GW-7A-02.
Total time: About a minute.
Why This Matters
- Stop the guesswork. When alarms spike, know immediately whether you’re dealing with one problem or twelve. Lens shows connections between affected feeds so you can fix the root cause instead of investigating symptoms.
- Scale without drowning in data. Add new regions, content types, or infrastructure without redesigning your monitoring setup. Create groups that make sense for your team, nest them however you want, and let feeds belong to multiple hierarchies simultaneously.
- Faster team coordination. When you can visually trace from “entire data center down” to “specific feed having issues,” shift handoffs get clearer. New team members understand the system structure in days instead of weeks.
How does Lens Work?
The setup: create groups matching your operational structure, tag your feeds with the relevant groups, and Lens builds the visual hierarchy automatically.
- Organize by location? Create groups for each data center and region.
- By content type? Tag feeds as news, sports, or entertainment.
- By network topology? Build groups around your signal path from ingest through playout to distribution.
Feeds can belong to multiple groups simultaneously. A single channel might be tagged as “US West” + “1080p” + “Sports” + “Packaging.” When issues arise, view the problem through whichever perspective makes sense for troubleshooting.
Click any feed and Lens highlights every group it belongs to across all hierarchies.
Example:
“TSN-HD-1” triggers a packet loss alarm.
Click it, and Lens highlights it in five hierarchies simultaneously:
- Toronto Data Center →
- Rack 12B (location), Sports Content →
- Hockey Feeds (content type), Acquisition Workflow →
- Live Ingest (signal path), 1080p60 Streams (technical spec), and
- Rogers Media Sources (content provider).
The visual highlighting reveals three other Rogers feeds in the same rack also showing elevated packet loss—a pattern invisible in a flat list.
Navigation options:
- Expand groups step by step to narrow focus
- Jump to the full hierarchy to see everything at once
- Highlight a specific group to see only what’s connected
- Trace any feed back to all its root groups
- Filter by severity to show only critical issues or hide lower-priority alerts
That last option matters when managing hundreds or thousands of channels. During major incidents, filter out everything except critical alerts to focus on what’s actively breaking. During routine monitoring, show all severity levels to catch trends before they become problems.
Every view shows alarm severity distribution color-coded by urgency. Switch between absolute numbers (alarms versus total channels) or relative percentages (distribution within affected feeds).
Real-World Example: Regional Sports Networks
A regional sports broadcaster monitors 156 active channels across three networks (Northeast, Southeast, West Coast). Each network carries 4–6 professional sports teams. For each game, they receive contribution feeds from venue cameras (typically 8–12 per game) and distribute to 15–20 cable affiliates, each requiring different encoding parameters and backup paths.
During a live Red Sox game, 18 distribution feeds trigger “video freeze” alarms within 30 seconds. The Lens interface shows all 18 in a cluster under Northeast → Red Sox → Distribution, while contribution feeds remain green. The team immediately checks the encoding rack serving those distribution paths rather than investigating 18 separate affiliate connections. Root cause: single transcoder failure affecting all downstream affiliates. Diagnosis time: from 15 minutes of individual checks to under 90 seconds.
This scales whether you’re managing dozens of channels or thousands.
The Bottom Line
Monitoring generates massive amounts of data. The challenge is making sense of it when things go wrong.
Lens doesn’t add more data, it adds context. It shows relationships between your feeds so you can see patterns instead of just individual failures.
When your infrastructure spans multiple sites, serves different content types, and handles dozens of simultaneous workflows, a flat list doesn’t cut it anymore. You need to see the structure.
That’s what Lens delivers: visual confirmation of system health at a glance, with the ability to drill down to specifics in seconds.
Lens is available in TAG MCS version 1.7.0 and later.
Lens is an interactive graphical interface in TAG’s Media Control System (MCS) that visualizes all monitored sources and their active alarms using a hierarchy of metadata-based groups. It helps operations teams quickly understand system health and perform fast root-cause analysis when multiple alarms occur at once.
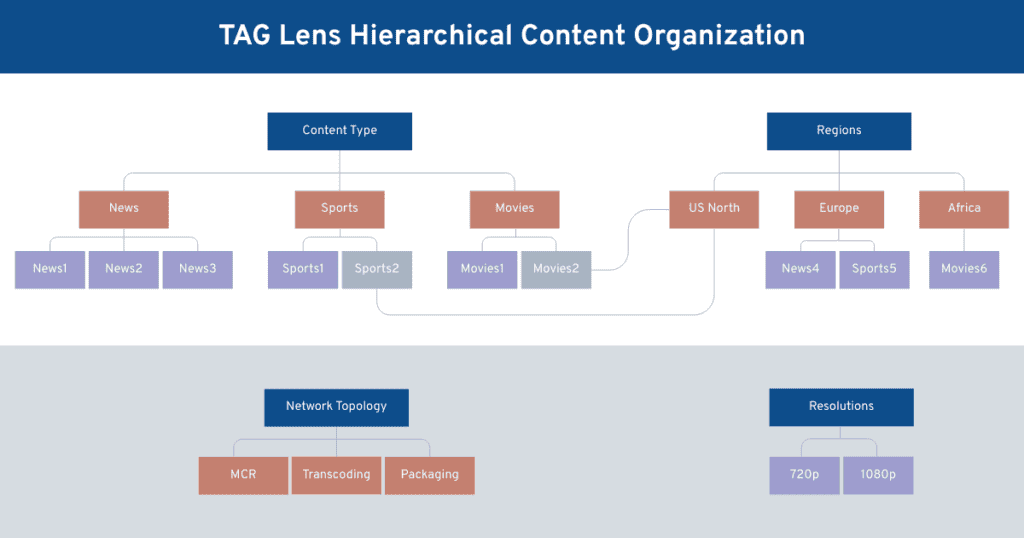
Lens uses a hierarchy of customizable metadata groups (called “Groups” in MCS) that represent how your operation is structured. Sources are “tagged” with relevant child-groups, and Lens automatically builds a navigable hierarchy showing the relationship between groups and sources.
Lens supports flexible grouping based on operational needs, including:
-
Data centers / regions (US West → Rack 7 → Encoder sources)
-
Content types (Sports → Basketball → game feeds)
-
Resolutions / technical formats (UHD / 1080p / 720p)
-
Providers / owners (OTT, Sports Production, Live Production Facility)
- Network topology / workflow (Ingest → Tx → HeadEnd → Post-CDN)
This lets teams troubleshoot through the lens that matches how they work.
Yes. A key capability of Lens is that sources (and groups) can be associated with multiple parent groups, enabling more complex operational views. For example, a single source can be grouped by both content type (Sports) and resolution (1080p), allowing engineers to investigate incidents from multiple perspectives without duplicating configuration.
Lens provides severity visualization using color-coded indicators.
- At the group level, Lens shows alarm distribution by severity relative to the group’s total sources, allowing quick health assessment “at a glance.”
- At the source level, each source circle is colored according to its most severe alarm, while grey indicates no alarms.
This makes it easy to detect systemic failures versus isolated source issues.
Lens is designed for interactive troubleshooting. Operators can:
-
Expand/collapse groups (drill down)
-
Show the full hierarchy (expand down to sources)
-
Highlight a group or source and its connected context
-
Trace paths back to root groups (especially useful in multi-parent hierarchies)
Open detailed views via “Info” actions
These actions support rapid investigation without switching between multiple tools.
Lens supports intuitive workspace navigation:
-
Zoom in/out (mousewheel and UI controls)
-
Pan/drag the workspace
-
Reset view to fit window
-
Refresh view
-
Expand to full tree / collapse to roots
-
Show/hide source labels
This makes Lens usable for both small deployments and environments with thousands of sources.
Yes. Lens includes two major filtering mechanisms:
- Severity filters — click severity levels (Critical, Major, Minor, etc.) to show only alarms of interest. Selecting none displays all alarms.
- Group filtering — users can filter groups via the Filter Groups menu and search by group name.
Note: Root groups are always visible and cannot be filtered out.

Michael Demb | VP Product Strategy | TAG Video Systems
Michael Demb is Vice President of Product Strategy at TAG Video Systems, turning broadcast challenges into practical products. With 20+ years in media technology, he brings a hands-on approach to helping customers adopt IP and software-defined workflows. Based in Toronto with his wife and three kids, he’s usually tackling DIY projects or skiing when he’s not working.